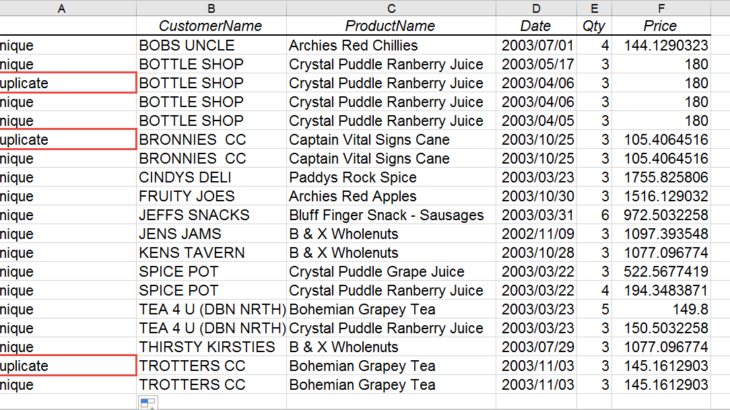
In a previous tip, we explained how you can easily remove duplicate rows from your data using the Remove Duplicates function. You can find it here. At times though, you may just want to highlight duplicate rows without actually deleting them. In this tip, we show you how you can do this using an Excel […]
- Solutions
All Solutions
- Standalone Reporting Tool
- Sage Intelligence for Accounting
- Sage 300cloud Intelligence
- Sage 50cloud Pastel Intelligence Reporting
- Sage Pastel Payroll Intelligence Reporting
- Sage 100/200 Evolution Intelligence Reporting
- Sage 100 Intelligence Reporting
- Sage 300 Intelligence Reporting
- Sage 500 Intelligence Reporting
- Sage VIP Intelligence Reporting
- Resources
All Solutions
- Standalone Reporting Tool
- Sage Intelligence for Accounting
- Sage 300cloud Intelligence
- Sage 50cloud Pastel Intelligence Reporting
- Sage Pastel Payroll Intelligence Reporting
- Sage 100/200 Evolution Intelligence Reporting
- Sage 100 Intelligence Reporting
- Sage 300 Intelligence Reporting
- Sage 500 Intelligence Reporting
- Sage VIP Intelligence Reporting
Additional Reports
Download our latest Report Utility tool, giving you the ability to access a library of continually updated reports. You don’t need to waste time manually importing new reports, they are automatically imported into the Report Manager module for you to start using.Sage Intelligence Tips & Tricks
Our Sage Intelligence Tips and Tricks will help you make the most of your favorite reporting solution.Excel Tips & Tricks
Our Excel Tips and Tricks will help you improve your business reporting knowledge and skills.- Learning
- Support
All Solutions
- Standalone Reporting Tool
- Sage Intelligence for Accounting
- Sage 300cloud Intelligence
- Sage 50cloud Pastel Intelligence Reporting
- Sage Pastel Payroll Intelligence Reporting
- Sage 100/200 Evolution Intelligence Reporting
- Sage 100 Intelligence Reporting
- Sage 300 Intelligence Reporting
- Sage 500 Intelligence Reporting
- Sage VIP Intelligence Reporting
Additional Reports
Download our latest Report Utility tool, giving you the ability to access a library of continually updated reports. You don’t need to waste time manually importing new reports, they are automatically imported into the Report Manager module for you to start using.Sage Intelligence Tips & Tricks
Our Sage Intelligence Tips and Tricks will help you make the most of your favorite reporting solution.Excel Tips & Tricks
Our Excel Tips and Tricks will help you improve your business reporting knowledge and skills.Get Support Assistance
Can’t find the solution to the challenge you’re facing in the resource library? No problem! Our highly-trained support team are here to help you out.Knowledgebase
Did you know that you also have access to the same knowledgebase articles our colleagues use here at Sage Intelligence? Available 24/7, the Sage Intelligence Knowledgebase gives you access to articles written and updated by Sage support analysts.Report Writers
Having some trouble creating or customizing the exact report you need to suit your business’s requirements? Contact one of the expert report writers recommended by Sage Intelligence.- Sage City
- University
- About Us
- Contact Us
Home Excel
How to create a linked dashboard (or landing page) for your Excel workbook
Have you ever had the pleasure (or displeasure) of working with an extra large Excel workbook with many, many different sheets? This happens frequently, especially if you are working with a large amount of data that needs to be analyzed periodically. This may be due to multiple tables, lookups, references, charts, graphs etc. This has […]
How to add a variance and running total in a Pivot Table
In our example workbook, we’re working with Date, Value In and Value Out fields. We need to create a Pivot Table that will also display the variance per month, as well as a running total of the variance for the year. In this tip, we show you how to do this. First up; select your […]
Sorting data in a PivotTable with Microsoft Excel
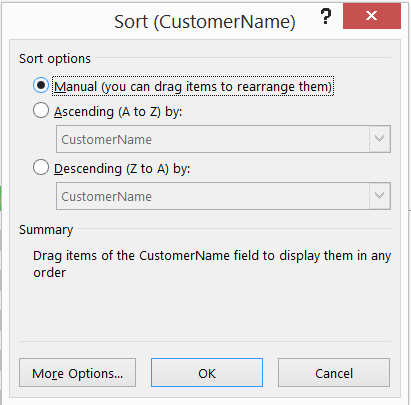
Sorting data in alphabetical order or numerical order is helpful when you have large amounts of data in the PivotTable you created. Sorting lets you organize the data so it is easier to find the items you want to analyze. 1. Within the PivotTable, click a field in the row or column you want to […]
How to reduce the size of a workbook using a single formula
Sometimes, large Microsoft Excel workbooks can be slow and inefficient—which could cause frustration. To reduce the size of a workbook, consider replacing several formulas with a single array formula. Array formulas can perform multiple calculations and they also ensure consistency, which can lead to greater accuracy. Furthermore, array formulas provide for more security, since a […]
How to create a Hierarchy SmartArt Graphic in Excel
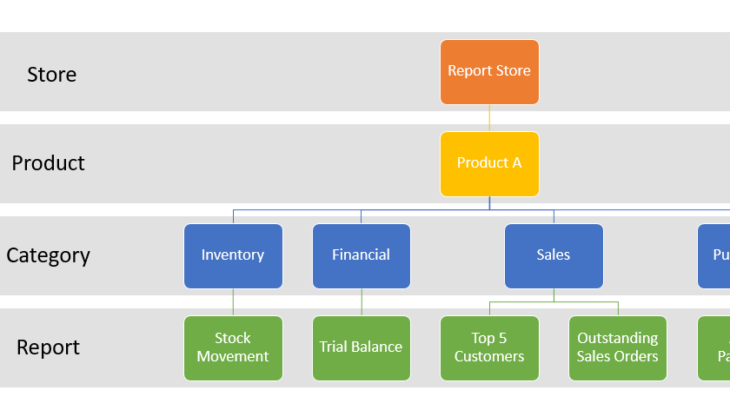
Microsoft Excel offers you the ability to create and design a Hierarchy SmartArt Graphic. This is useful in showing a graphical representation of an organogram, organisation chart or any hierarchy structure. This example, explained below, will help you create your own hierarchy. Our example scenario is of a Report Store that contains reports created for […]
Save your entire report to PDF using macros and Sage Intelligence
Being able to save your reports to PDF provides a convenient way to view and share them. Sage Intelligence provides two common ways that you can do this. These include; distributing a report as a PDF using the Distribution Options in Excel once a report has run out, and using the Generate Output File field […]
Using the VLOOKUP formula with the approximate match in Excel
Have you ever used the VLOOKUP formula with the approximate match in Excel? By using this formula, you’re able to extract the correct trade discount percentage based on the quantity of a specific item purchased. In this tip, we demonstrate how to set this up. If TRUE or 1 is specified in the Range_lookup argument text […]
Heroes unite: How Excel and Power BI can defeat misinformation together
Ever pictured the most popular business reporting and analytics tools as superheroes, fighting to defend businesses against pesky misinformation? Well, our in-house business intelligence specialist, Nigel Naicker, has. Here’s his creative account of how two well-known heroes, Excel and Power BI, can unite and use their superpowers together to defeat misinformation for good! The city […]
Inserting 3D models into an Excel spreadsheet
This is a tip that you’re going to really enjoy if you love imagery and visualisations in your spreadsheet! It’s not the most useful tip in the world, but for most people, especially the creative types—it will put a smile on your face because it’s so much fun to play with. In this tip, I’m […]
Return to topLearning
Sage South Africa © Sage South Africa Pty Ltd 2020
.
All Rights Reserved.


