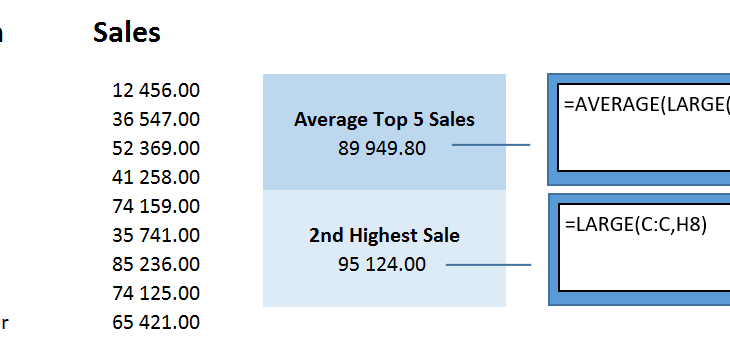
Let’s say you have a workbook containing sales over a two year period. You would now like to know what the average is for your top 5 sales values, as well as the value for your largest sale. In our example, which you are welcome to download here, we are using Column A for the […]
- Solutions
All Solutions
- Standalone Reporting Tool
- Sage Intelligence for Accounting
- Sage 300cloud Intelligence
- Sage 50cloud Pastel Intelligence Reporting
- Sage Pastel Payroll Intelligence Reporting
- Sage 100/200 Evolution Intelligence Reporting
- Sage 100 Intelligence Reporting
- Sage 300 Intelligence Reporting
- Sage 500 Intelligence Reporting
- Sage VIP Intelligence Reporting
- Resources
All Solutions
- Standalone Reporting Tool
- Sage Intelligence for Accounting
- Sage 300cloud Intelligence
- Sage 50cloud Pastel Intelligence Reporting
- Sage Pastel Payroll Intelligence Reporting
- Sage 100/200 Evolution Intelligence Reporting
- Sage 100 Intelligence Reporting
- Sage 300 Intelligence Reporting
- Sage 500 Intelligence Reporting
- Sage VIP Intelligence Reporting
Additional Reports
Download our latest Report Utility tool, giving you the ability to access a library of continually updated reports. You don’t need to waste time manually importing new reports, they are automatically imported into the Report Manager module for you to start using.Sage Intelligence Tips & Tricks
Our Sage Intelligence Tips and Tricks will help you make the most of your favorite reporting solution.Excel Tips & Tricks
Our Excel Tips and Tricks will help you improve your business reporting knowledge and skills.- Learning
- Support
All Solutions
- Standalone Reporting Tool
- Sage Intelligence for Accounting
- Sage 300cloud Intelligence
- Sage 50cloud Pastel Intelligence Reporting
- Sage Pastel Payroll Intelligence Reporting
- Sage 100/200 Evolution Intelligence Reporting
- Sage 100 Intelligence Reporting
- Sage 300 Intelligence Reporting
- Sage 500 Intelligence Reporting
- Sage VIP Intelligence Reporting
Additional Reports
Download our latest Report Utility tool, giving you the ability to access a library of continually updated reports. You don’t need to waste time manually importing new reports, they are automatically imported into the Report Manager module for you to start using.Sage Intelligence Tips & Tricks
Our Sage Intelligence Tips and Tricks will help you make the most of your favorite reporting solution.Excel Tips & Tricks
Our Excel Tips and Tricks will help you improve your business reporting knowledge and skills.Get Support Assistance
Can’t find the solution to the challenge you’re facing in the resource library? No problem! Our highly-trained support team are here to help you out.Knowledgebase
Did you know that you also have access to the same knowledgebase articles our colleagues use here at Sage Intelligence? Available 24/7, the Sage Intelligence Knowledgebase gives you access to articles written and updated by Sage support analysts.Report Writers
Having some trouble creating or customizing the exact report you need to suit your business’s requirements? Contact one of the expert report writers recommended by Sage Intelligence.- Sage City
- University
- About Us
- Contact Us
Home BI in Excel Page 2
How to reduce the size of a workbook using a single formula
Sometimes, large Microsoft Excel workbooks can be slow and inefficient—which could cause frustration. To reduce the size of a workbook, consider replacing several formulas with a single array formula. Array formulas can perform multiple calculations and they also ensure consistency, which can lead to greater accuracy. Furthermore, array formulas provide for more security, since a […]
How to create a Hierarchy SmartArt Graphic in Excel
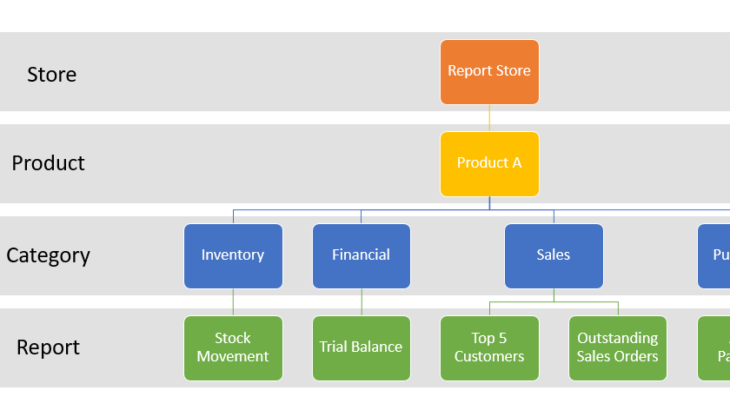
Microsoft Excel offers you the ability to create and design a Hierarchy SmartArt Graphic. This is useful in showing a graphical representation of an organogram, organisation chart or any hierarchy structure. This example, explained below, will help you create your own hierarchy. Our example scenario is of a Report Store that contains reports created for […]
Using the VLOOKUP formula with the approximate match in Excel
Have you ever used the VLOOKUP formula with the approximate match in Excel? By using this formula, you’re able to extract the correct trade discount percentage based on the quantity of a specific item purchased. In this tip, we demonstrate how to set this up. If TRUE or 1 is specified in the Range_lookup argument text […]
How to create more accurate forecasts with Excel
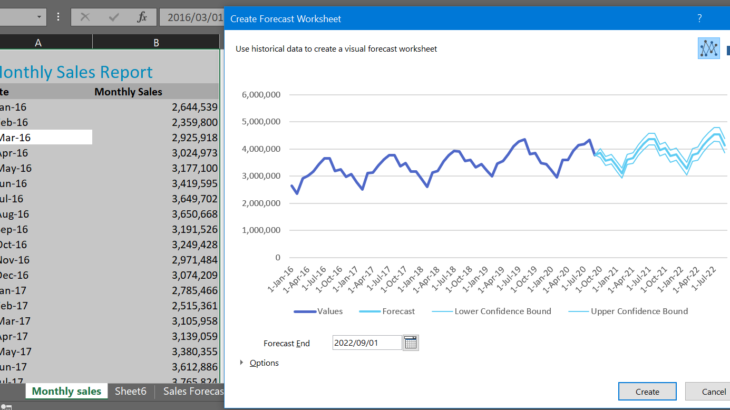
Do you need to future-proof your business? The Excel Forecast sheet may be the right tool for you! The Forecast sheet allows you to take your historical business data (sales, cash flow, etc.) and create more accurate forecasts for the future. You are welcome to download the workbook to practice! 1. To create a Forecast […]
What’s the big SO WHAT of business intelligence?
More and more companies are calling for the necessity of business intelligence (BI) and reporting. It’s fast becoming the it word in business, and regularly features in the discussions of many business circles. However, there seems to be a gap in understanding why we need BI. What’s the point of having BI? What’s the big […]
Learn how to navigate through your data quickly with keyboard shortcuts in Excel
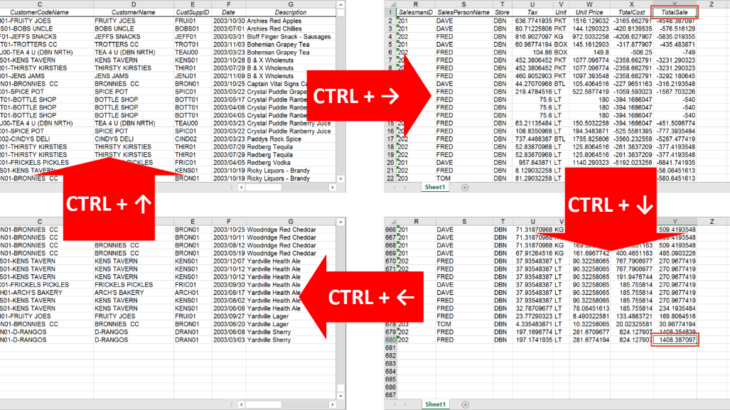
When working with large data lists in Excel, you may need to know the extent of the data, i.e. the number of rows and columns. If consistency of the data is important too, then you may need to identify whether there’s any empty rows, columns or cells. An obvious way to check this is by […]
Learn how to hide rows and columns using Named Ranges
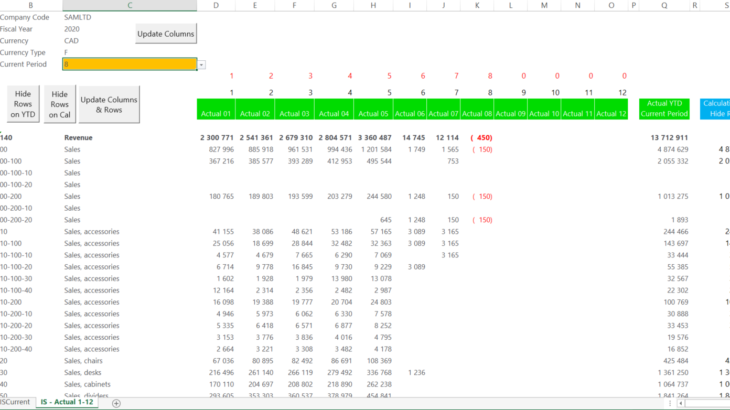
Do you have a workbook that could do with some neatening up? Being able to hide rows and columns in a report that contains data you don’t need to view is a great way to do this. An example of a report like this is a financial statement, which has account level detail and monthly […]
How to calculate the average useful life of assets
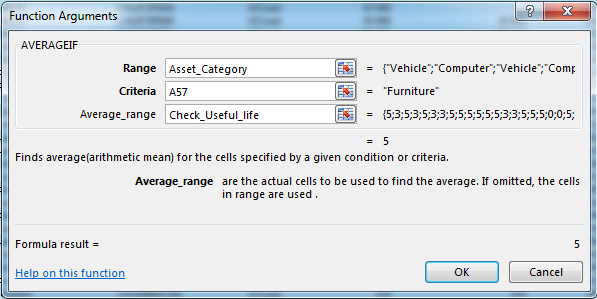
To complete an analytical review of the depreciation of your company’s assets, you can calculate the average useful life of these assets. The average useful life, which is a measure of conditional central tendency, can be calculated using the AVERAGEIF function. Central tendency is the middle value or a typical value within a data set. […]
Additional Sage Intelligence reports to boost your business
How would you like constant access to a library of additional reports? The Sage Intelligence Report Utility allows you to select the reports you like and automatically imports them into your Report Manager. All you need to do is download and install the Report Utility, select the reports you want, and click the Download button. […]
Return to topLearning
Sage South Africa © Sage South Africa Pty Ltd 2020
.
All Rights Reserved.

