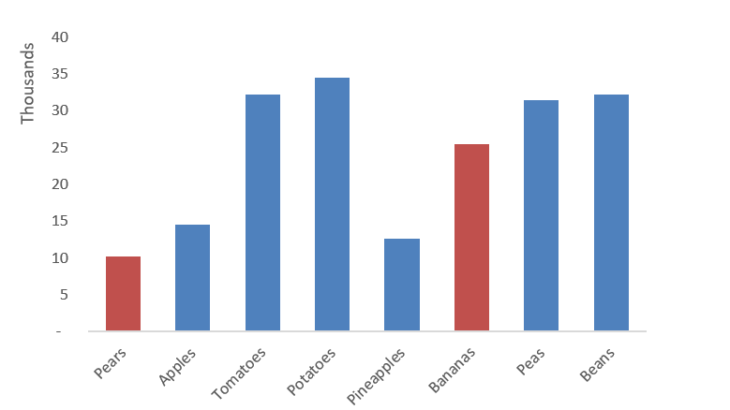
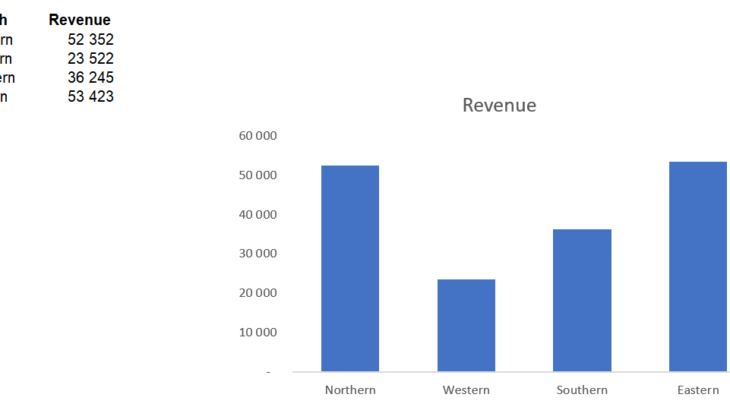
Have you ever experienced your Excel charts disappearing when you hide the columns showing the data? By default, Microsoft® Excel® shows only visible data in a chart. In this tip, we will show you how to easily overcome this problem, by following these simple steps: 1. First, lets create a simple chart with your data […]
- Solutions
All Solutions
- Standalone Reporting Tool
- Sage Intelligence for Accounting
- Sage 300cloud Intelligence
- Sage 50cloud Pastel Intelligence Reporting
- Sage Pastel Payroll Intelligence Reporting
- Sage 100/200 Evolution Intelligence Reporting
- Sage 100 Intelligence Reporting
- Sage 300 Intelligence Reporting
- Sage 500 Intelligence Reporting
- Sage VIP Intelligence Reporting
- Resources
All Solutions
- Standalone Reporting Tool
- Sage Intelligence for Accounting
- Sage 300cloud Intelligence
- Sage 50cloud Pastel Intelligence Reporting
- Sage Pastel Payroll Intelligence Reporting
- Sage 100/200 Evolution Intelligence Reporting
- Sage 100 Intelligence Reporting
- Sage 300 Intelligence Reporting
- Sage 500 Intelligence Reporting
- Sage VIP Intelligence Reporting
Additional Reports
Download our latest Report Utility tool, giving you the ability to access a library of continually updated reports. You don’t need to waste time manually importing new reports, they are automatically imported into the Report Manager module for you to start using.Sage Intelligence Tips & Tricks
Our Sage Intelligence Tips and Tricks will help you make the most of your favorite reporting solution.Excel Tips & Tricks
Our Excel Tips and Tricks will help you improve your business reporting knowledge and skills.- Learning
- Support
All Solutions
- Standalone Reporting Tool
- Sage Intelligence for Accounting
- Sage 300cloud Intelligence
- Sage 50cloud Pastel Intelligence Reporting
- Sage Pastel Payroll Intelligence Reporting
- Sage 100/200 Evolution Intelligence Reporting
- Sage 100 Intelligence Reporting
- Sage 300 Intelligence Reporting
- Sage 500 Intelligence Reporting
- Sage VIP Intelligence Reporting
Additional Reports
Download our latest Report Utility tool, giving you the ability to access a library of continually updated reports. You don’t need to waste time manually importing new reports, they are automatically imported into the Report Manager module for you to start using.Sage Intelligence Tips & Tricks
Our Sage Intelligence Tips and Tricks will help you make the most of your favorite reporting solution.Excel Tips & Tricks
Our Excel Tips and Tricks will help you improve your business reporting knowledge and skills.Get Support Assistance
Can’t find the solution to the challenge you’re facing in the resource library? No problem! Our highly-trained support team are here to help you out.Knowledgebase
Did you know that you also have access to the same knowledgebase articles our colleagues use here at Sage Intelligence? Available 24/7, the Sage Intelligence Knowledgebase gives you access to articles written and updated by Sage support analysts.Report Writers
Having some trouble creating or customizing the exact report you need to suit your business’s requirements? Contact one of the expert report writers recommended by Sage Intelligence.- Sage City
- University
- About Us
- Contact Us
Home Tips & Tricks Excel Tips & Tricks
Tips & Tricks
How to automatically highlight specific data using a bar chart in Excel
This Microsoft® Excel® tip will come in handy when you want to create a chart that will populate your data and highlight only specific parts of that data. Download the workbook to practise this exercise. In the example below, we will look at a grocery store. The chart displays the revenue generated from the produce […]
How to create a step chart in Excel
A step chart shows changes that occur over irregular intervals. For example, it can show stock movement changes, interest rates, etc. A step chart is the perfect alternative to a line chart as it displays the trend as well as the time taken between changes. The difference between a Step Chart and Line Chart: A line […]
How to format a chart in Excel to dynamically show its maximum value
Data visualisation is fast becoming the norm for effective business intelligence. Having visuals that tell the right story at a glance go a long way in achieving this. Microsoft® Excel® provides you with a multitude of ways to enhance the visuals that you create. In this tip, I’ll show you how to format a basic bar […]
Our Top 5 Excel tips of 2018
These Microsoft® Excel® tips and tricks are the top performing tips of 2018, and have raked up a combined viewership of over 200 000. Without further ado, here they are, the Top 5 Excel tips and tricks of 2018. How to consolidate data in Excel using Data Consolidation (66,027 views) How to get a distinct […]
Learn how to identify duplicate rows in your data
In a previous tip, we explained how you can easily remove duplicate rows from your data using the Remove Duplicates function. You can find it here. At times though, you may just want to highlight duplicate rows without actually deleting them. In this tip, we show you how you can do this using an Excel […]
How to create a linked dashboard (or landing page) for your Excel workbook
Have you ever had the pleasure (or displeasure) of working with an extra large Excel workbook with many, many different sheets? This happens frequently, especially if you are working with a large amount of data that needs to be analyzed periodically. This may be due to multiple tables, lookups, references, charts, graphs etc. This has […]
How to add a variance and running total in a Pivot Table
In our example workbook, we’re working with Date, Value In and Value Out fields. We need to create a Pivot Table that will also display the variance per month, as well as a running total of the variance for the year. In this tip, we show you how to do this. First up; select your […]
Using Wildcards to make finding or replacing data in Excel quicker and easier
This tip is useful when you want to replace or find text using Wildcards, e.g. if you have a column where you would like to replace everything after the space character with text. What are Wildcards? Wildcards are characters that are used to represent one or more characters. The following wildcard characters can be used […]
Sorting data in a PivotTable with Microsoft Excel
Sorting data in alphabetical order or numerical order is helpful when you have large amounts of data in the PivotTable you created. Sorting lets you organize the data so it is easier to find the items you want to analyze. 1. Within the PivotTable, click a field in the row or column you want to […]
Return to topLearning
Sage South Africa© Sage South Africa Pty Ltd 2020 . All Rights Reserved.